Whiteboard
This page contains information about Mermaid Chart’s Whiteboard feature.
About
Mermaid Chart’s Whiteboard feature allows you to create diagrams using drag and drop functionality. You can use our Mermaid AI to generate a diagram, open the generated diagram in the Editor to customize, and hop over to the Whiteboard for additional customization.
Access the Mermaid AI, Editor, and Whiteboard features by clicking on the toggles in the center of the screen.
How to get to the Whiteboard
From the Dashboard, click on the “New diagram” button. This will take you to the Editor. At the top center of the Editor are menu toggles for the Mermaid AI, Editor, and Whiteboard. Click on the Whiteboard menu toggle to access the Whiteboard. Switch between the Mermaid AI, Editor, and Whiteboard to create the perfect diagram.
Whiteboard features
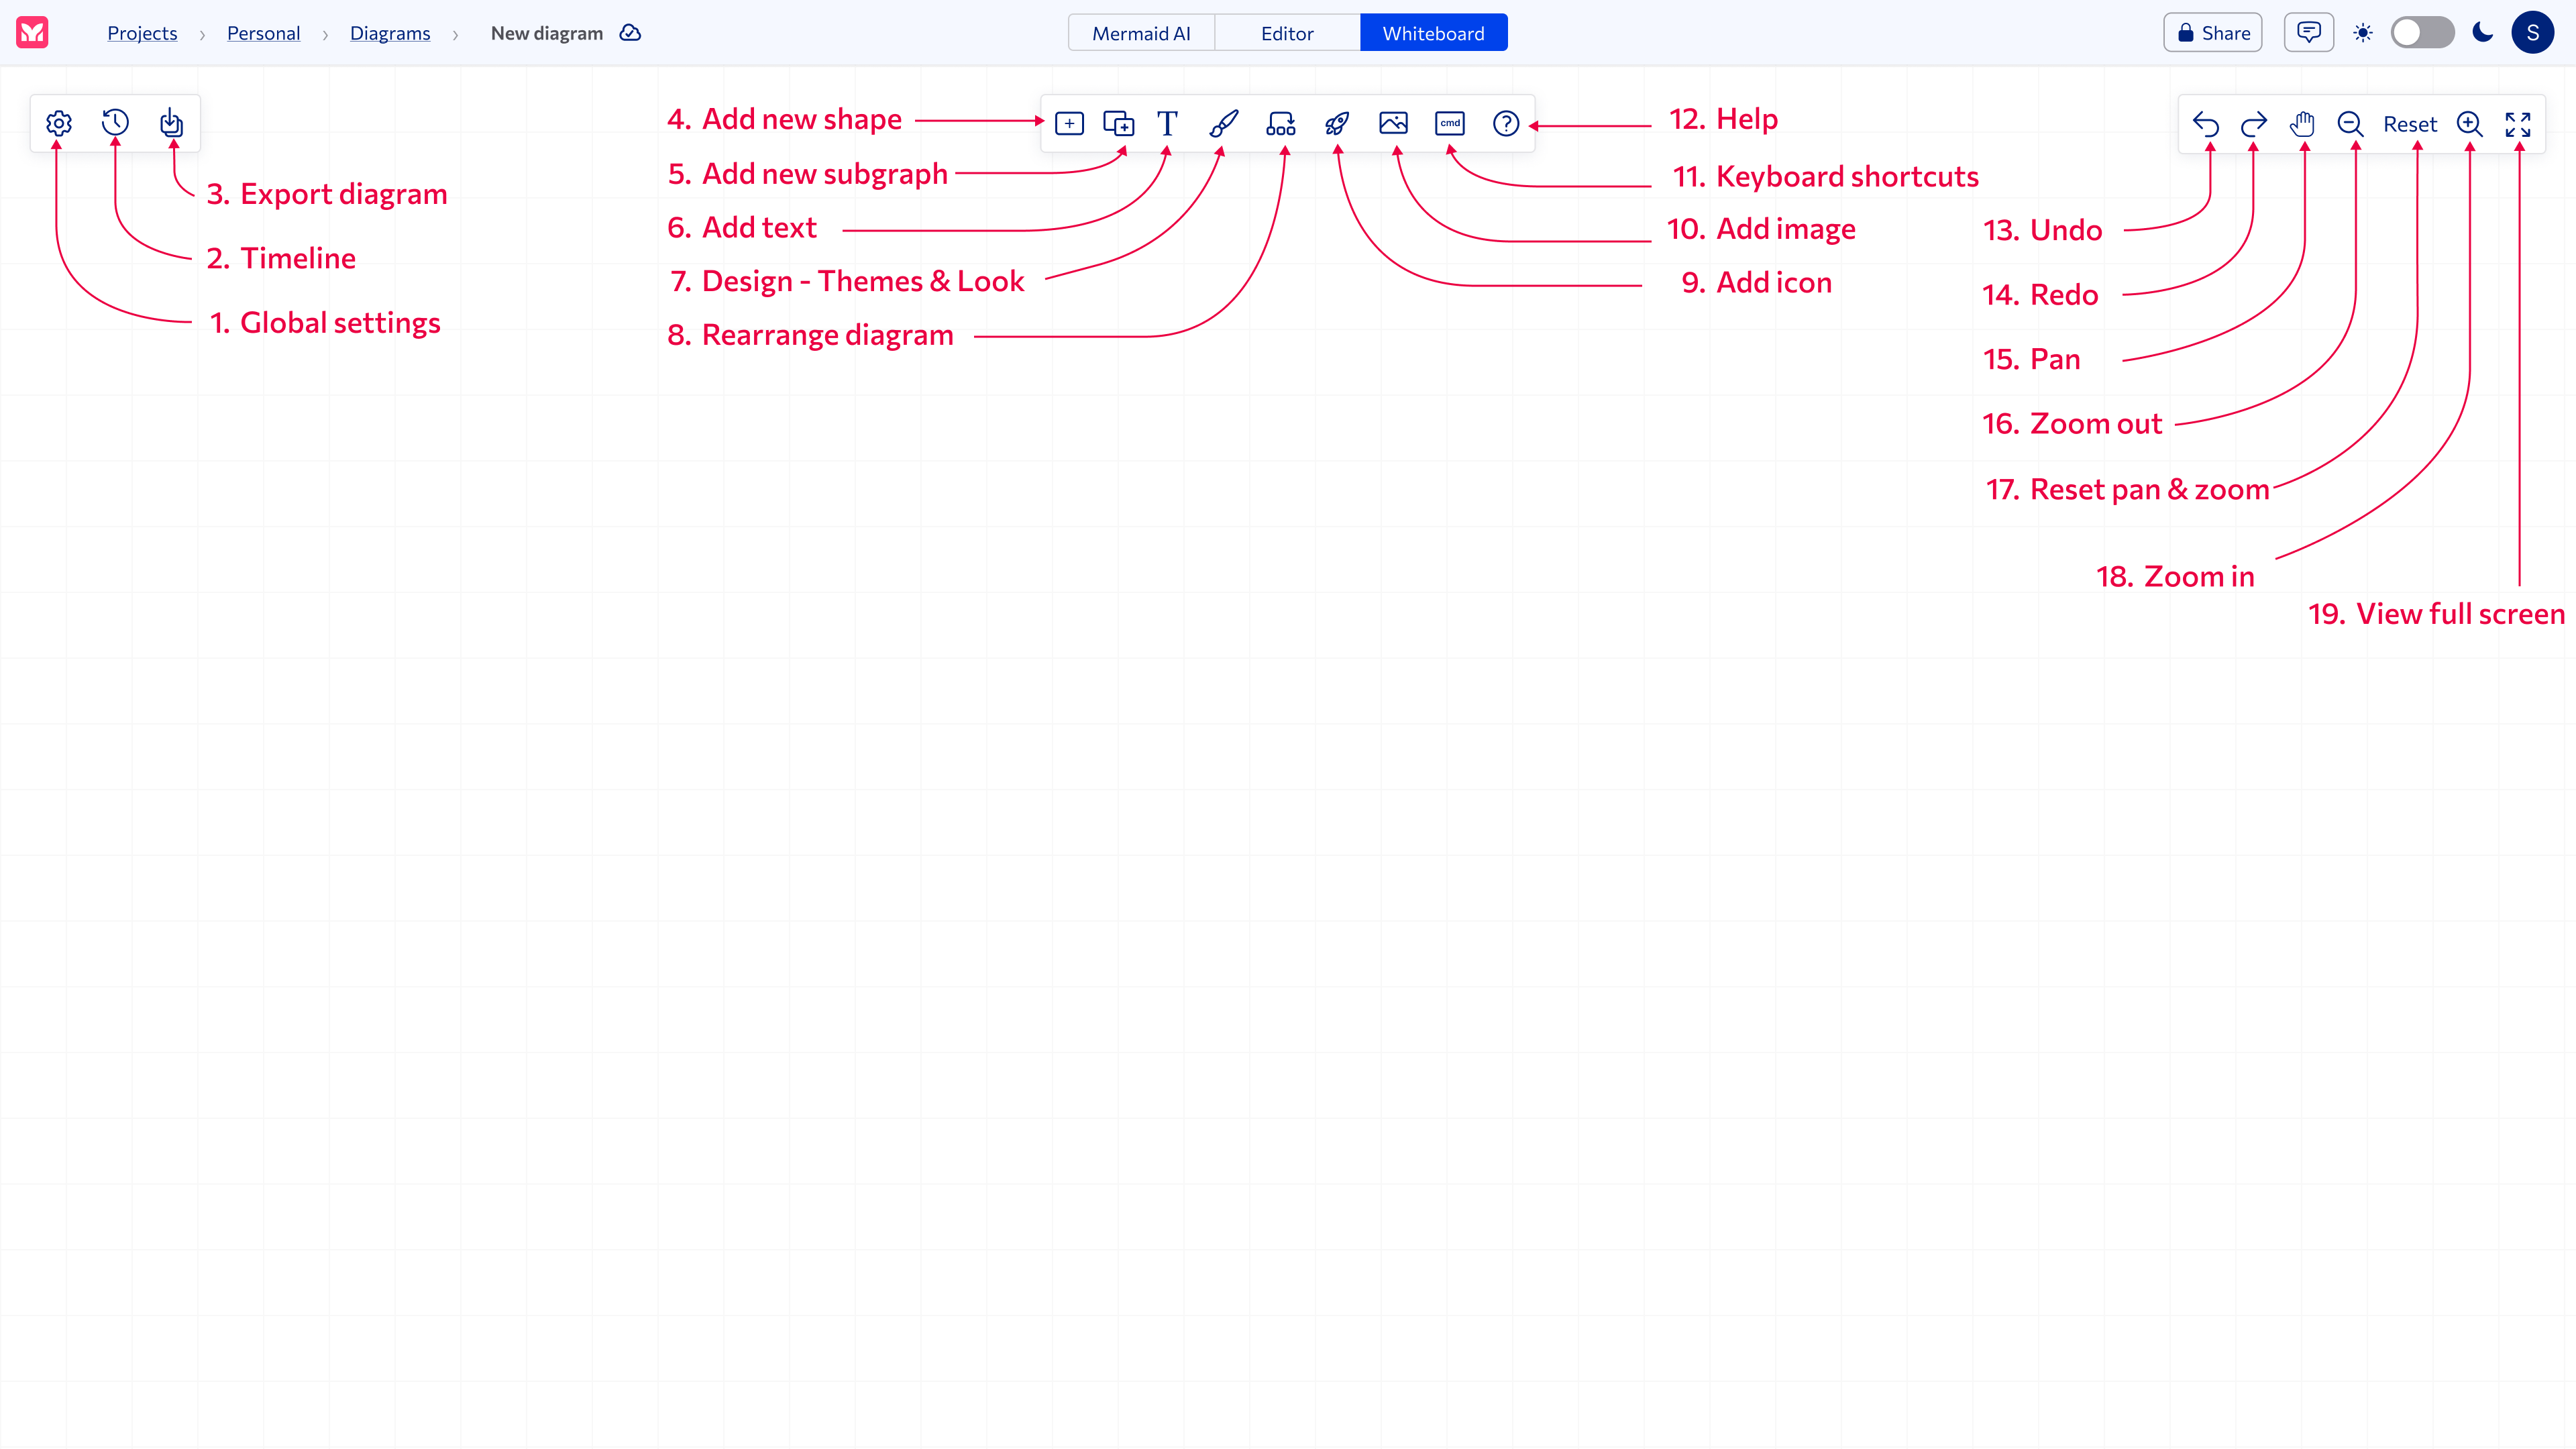
Left toolbar
(1) Global settings
Click on the Global settings icon to access the following options:
• Theme
• Look
Updating the theme and look will apply to all diagrams.
(2) Timeline
Click on the Timeline icon to access the following options:
• Restore diagram versions
• Clear history
(3) Export diagram
Click on the Export diagram icon to access the following options:
• Export as PNG
• Export as SVG
Center toolbar
(4) Add new shape
Click on the Shapes icon to access the following options:
• Basic shapes
• Process shapes
• Technical shapes
Click on the node to access the toolbar with the following options:
• classDef
• Shapes
• Border
• Border color
• Background color
• Text color
• Delete node
(5) Add subgraph
Click on the Subgraph icon to add a subgraph to the diagram.
(6) Add text
Click on the Text icon to add text to the diagram.
(7) Design - Themes & Look
Click on the Design icon to access the following options:
• Themes
- Mermaid Chart
- Neo
- Neo dark
- Default
- Forest
- Base
- Dark
- Neutral
• Look
- Neo
- Hand drawn
- Classic
(8) Rearrange diagram
Click on the Rearrange icon to rearrange the diagram.
Choose from the following options:
• Using hierarchical layout
• Using adaptive layout
(9) Add icon
Click on the Icon icon to add an icon to the diagram.
Click on the icon to access the toolbar with the following options:
• icons
• background form
• background color
• icon color
• text
• icon size
• icon title
• delete icon
(10) Add image
Click on the Image icon to add an image to the diagram.
Click on the image to access the toolbar with the following options:
• update image URL
• set image size (height and width)
• image title
• delete image
(11) Keyboard shortcuts
Click on the Keyboard shortcuts icon to access a side menu showing the keyboard shortcuts.
Keyboard shortcuts are available for the following for Windows and Mac operating systems.
(12) Help
Click on the Help icon to access the following options:
• User Survey
• Issue Tracker
• User Guide
Right toolbar
(13) Undo
Click on the Undo icon to undo the last action.
(14) Redo
Click on the Redo icon to redo the last action.
(15) Pan
Click on the Pan icon to pan the diagram.
(16) Zoom out
Click on the Zoom out icon to zoom out.
(17) Reset pan & zoom
Click on the Reset pan & zoom icon to reset the pan and zoom.
(18) Zoom in
Click on the Zoom in icon to zoom in.
(19) View full screen
Click on the View full screen icon to view the diagram in full screen.
Other features
Multiple selection
Drag your cursor to select multiple nodes and edges. Move your selection around the Whiteboard, or click on the delete icon to delete your selection.
Edges
Click on any edge to access the toolbar with the following options:
• arrow type
• edge stroke
• edge color
• delete edge
Share diagram
Click on the Share icon to share the diagram with others for collaboration.
• invite via email
• set diagram permissions
• share a link to the Editor
• share an SVG link
Comments
Click on the Comments icon to add comments to the diagram.
Viewable in the Editor and Whiteboard.